
CCG Electronics Manufacturing Daily News & Executive Summary w/Presentation, April 17, 2026
Subscribers receive content like this daily. Contact me if you are interested.
Jon
- Global Economic Context and Trade Policy Volatility
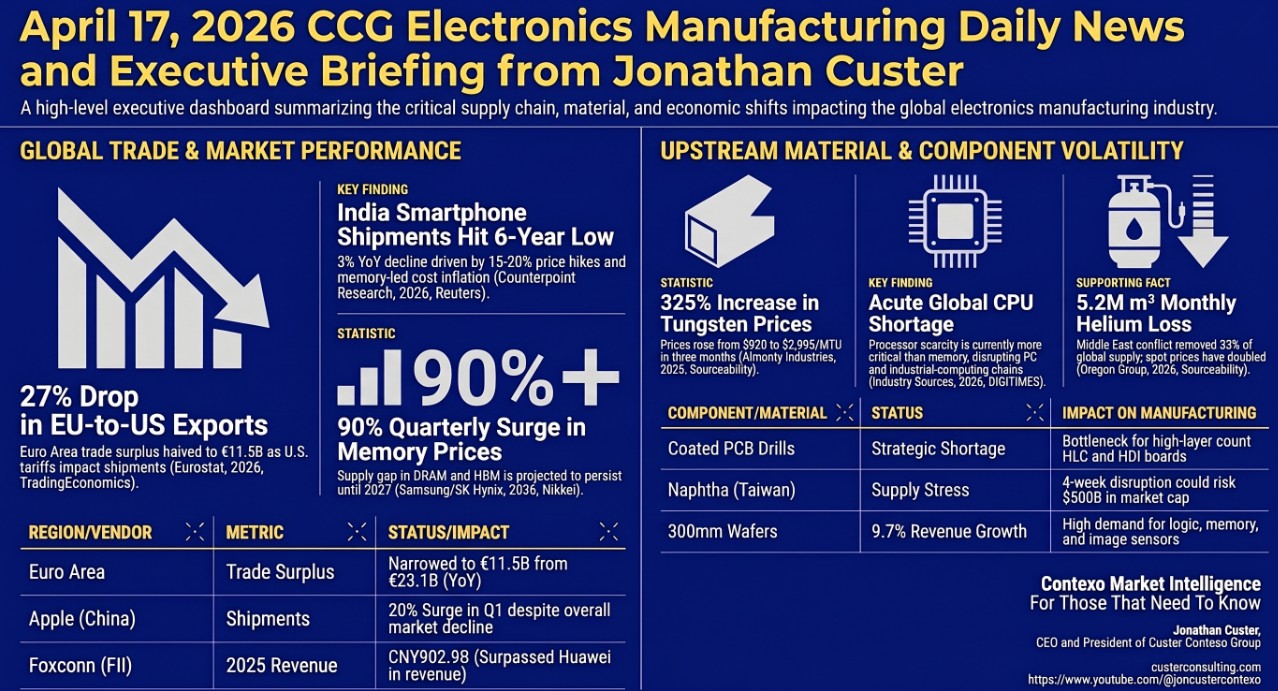
The global trade landscape is undergoing a brutal structural realignment as protectionist gravity collides with demand-side desperation. The Euro Area trade surplus narrowed to €11.5 billion in February 2026—missing analyst expectations of €11.7 billion—driven by a 6.7% year-on-year drop in exports (TradingEconomics, 2026, Eurostat). While U.S. tariffs have triggered a steep 26% drop in EU shipments for two consecutive months, a critical strategic insight is emerging: “economic gravity” is overriding protectionist costs in high-scarcity sectors. Despite facing 50% U.S. tariffs, European exports of aluminum and copper increased by 9% and 15% respectively in late 2025, as domestic U.S. capacity deficits force manufacturers to absorb the tariff blow to sustain production (Philip Blenkinsop, 2026, Reuters). For the C-suite, this signals that while policy volatility creates friction, the fundamental lack of material self-sufficiency remains the primary driver of supply chain behavior.
Trade Balance and Export Dynamics (February 2026)
| Metric | February 2026 Value | Year-Over-Year Change |
| Euro Area Trade Surplus | €11.5 Billion | -50.2% (Narrowed below €11.7B forecast) |
| Total Exports | €232.4 Billion | -6.7% |
| Chemicals Sector Surplus | €16.2 Billion | -46.7% (from €30.4B) |
| Machinery & Vehicles Surplus | €10.2 Billion | -28.2% (from €14.2B) |
| Energy Deficit (Improvement) | €20.0 Billion | +20.6% (Narrowed from €25.2B) |
Source: (TradingEconomics, 2026, Eurostat)
The strategic resilience of sectors like Finnish shipbuilding—evidenced by Meyer Turku’s delivery of the “Star of the Seas” and its secured reservations through 2036—illustrates that long-term infrastructure demand can bypass short-term trade wars (Philip Blenkinsop, 2026, Reuters). However, for the high-volume electronics sector, these trade-driven margin pressures are now being compounded by the escalating costs of raw materials that are becoming weaponized in regional conflicts.
- Strategic Material Risks: Tungsten, Helium, and Naphtha
Volatility in critical materials represents a dangerous “blind spot” in standard procurement strategies. While C-level focus often lingers on fab capacity, regional conflicts are transforming raw materials into strategic chokepoints. Tungsten, essential for leading-edge chip interconnects, has seen its spot price surge from $920 to $2,995 per MTU since January, with supply-demand deficits projected to persist through 2033 (Sourceability, 2026, Almonty Industries). This is no longer a pricing fluctuation; it is a structural scarcity event.
Critical Material Risk Assessment
| Material | Strategic Disruption Impact | Market Consequence |
| Helium | Supply loss of 5.2M cubic meters/month; Qatar production halted by Iranian attacks. | Spot prices doubled; U.S. holds strategic leverage with 81M cubic meters (2025). |
| Naphtha | Geopolitical pressure on Russian supply; Hormuz closure passed 4-week mark on March 28. | $500B market cap risk associated with a four-week disruption to semiconductor inputs. |
Source: (Sourceability, 2026, The Oregon Group, Fab Economics)
The closure of the Strait of Hormuz, which passed the critical four-week mark on March 28, represents a ticking clock for fab-grade chemical supplies. While the U.S. maintains strategic leverage as a primary helium producer, global buyers are pivoting toward non-China sources of Tungsten, such as Vietnam’s Nui Phao mine. The impending sale of Nui Phao is attracting intense interest from Western and Japanese investors seeking to bypass Beijing’s export controls (Francesca Stevens & Nguyen Dieu Tu Uyen, 2026, Bloomberg). As raw material scarcity hardens, the electronics industry is facing an immediate secondary shock in the pricing and availability of core components.
- Component Market Conditions and Semiconductor Capacity
Hardware manufacturers are currently trapped in an “affordability squeeze” as pricing cycles for legacy and next-generation components diverge. While AI-driven data center demand monopolizes high-end capacity, legacy industrial components are being hit by raw material inflation.
- Taiyo Yuden: Notified distributors of price adjustments effective May 1, 2026, across MLCCs, inductors, and ferrite beads, citing gold and silver cost pressures that internal controls can no longer offset (Levi Li, 2026, DIGITIMES Asia).
- Yageo: Currently negotiating 10-20% price increases across tantalum capacitors and chip resistors to stabilize margins against 2026 inflation (Levi Li, 2026, DIGITIMES Asia).
In the semiconductor tier, the CPU shortage has become more acute than memory. Intel’s Raptor Lake series is effectively unavailable, with lead times described as “meaningless” (Aaron Lee, 2026, DIGITIMES). This scarcity is exacerbated by yield issues at Intel 18A, which remain below expectations. Ericsson has already signaled a “flattish RAN market” as it struggles to manage these semiconductor input costs (Börje Ekholm, 2026, Ericsson).
To breach the “Moore’s Law wall,” the industry is shifting toward “disaggregation”—the stitching together of silicon die components via advanced packaging. Intel and TSMC are aggressively pursuing glass-core substrates to enable this architectural shift (Dr. Ravi Mahajan, 2026, Intel). TSMC is simultaneously expanding 3nm production in Taiwan, Arizona, and Kumamoto, while UMC has signaled 2026 wafer price adjustments as capacity tightens (TSMC, 2026, CNA; Monica Chen, 2026, DIGITIMES). This tightening of component availability is fundamentally altering the infrastructure of manufacturing hubs.
- Manufacturing Transformation: Resilience, Reshoring, and Automation
North America is in the midst of a “Stealth Manufacturing Boom.” While factory employment has dipped by 0.6%, output has risen 2.3% since early 2025 (Greg Ip, 2026, WSJ). Executives must distinguish between the “Snow Globe” economy—low-tech sectors like Food and Beverages, which hold an 18% share of U.S. manufacturing—and the high-complexity compute sector that is driving the AI revolution.
Strategic shifts are also visible in the Indo-Pacific. India is moving away from simple “build-to-print” assembly toward a “design-led” Independent Design House (IDH) model, supported by the $765 million ECMS scheme (Yashasvini Razdan, 2026, EE Times). However, China maintains a “chokehold” on the underlying equipment and materials, hindering India’s ability to build a fully autonomous ecosystem (CT Bureau, 2026).
AI-Driven Factory and Expansion Initiatives (2026)
| Facility/Expansion | Investment/Size | Strategic Objective |
| InnoTek (Malaysia) | RM16 Million | Precision metal-stamping to mitigate China supply chain risks. |
| RBB Systems (U.S.) | 3,500 sq. ft. | Facility expansion for high-precision avionics and 3D Solder Paste Measurement. |
| Foxconn (U.S.) | Advanced AI Fab | Deployment of digital twins and humanoid robot training (Nvidia GR00T). |
Source: (Ninelu Tu, 2026, DIGITIMES; Bruce Richard, 2026, Jabil)
A major technological pivot is the adoption of Panel-Level Packaging (PLP). As AI chips exceed the reticle limit, wafer-level economics are breaking down, forcing a move to 310mm x 310mm rectangular substrates (Gregory Haley, 2026, SemiEngineering). This physical shift in manufacturing centers is now being mirrored by the expansion of data infrastructure into the orbital frontier.
- Emerging Frontiers: Aerospace and Advanced Packaging
The strategic frontier has moved into “Grey Zone” satellites—dual-use assets that mask military objectives behind commercial operations. In this environment, “Technological Sovereignty” is defined by the ability to detect Rendezvous and Proximity Operations (RPO) and “soft-kill” threats like uplink jamming or sensor dazzling in real-time (satnews.com, 2026; Lockheed Martin, 2026).
Orbital data centers are moving from theory to operation, driven by launch costs falling to $2,800/kg (David Hodes, 2026, satellitetoday.com). Lonestar Data Holdings’ “Stargate” project is positioning space as a physically isolated, secure layer for immutable data storage, taking advantage of space’s natural thermal shedding (David Hodes, 2026, satellitetoday.com). Simultaneously, Beijing is completing its “Satellite Town” to foster industrial clustering, while OQ Technology adapts 5G beamforming for space to bridge the gap between terrestrial and orbital networks (Mei Mei Chu, 2026, Reuters; OQ Technology, 2026).
- Executive Summary: SWOT Analysis and Profit Guidance
SWOT Analysis for Electronics Manufacturing
- Strengths: Accelerated adoption of Panel-Level Packaging (PLP); domestic high-end compute booms in the U.S. and India.
- Weaknesses: Acute CPU and memory scarcity; continued dependence on Chinese raw materials for indigenous manufacturing.
- Opportunities: The rise of orbital data centers (Lonestar); 3D-printing freeform electronics using focused microwave technology (Rice University/Yong Lin Kong, 2026, Science Advances).
- Threats: Closure of Middle East supply routes for Helium/Naphtha; protectionist “EU Chips Act 2.0” causing regional fragmentation.
Executive Profit Guidance
- Inventory Hedging: Secure HBM and specialty gases immediately. Memory prices for Q1 2026 have surged by 90%, and shortages are projected through 2027 (Siu Han, 2026, DIGITIMES).
- Geographic Optionality: Maintain high-end engineering proximity in the U.S. while leveraging USMCA (Mexico) for labor-intensive assembly to mitigate tariff volatility and labor shortages (Bruce Richard, 2026, Jabil).
- In-House DFM: Adopt in-house Design for Manufacturing (DFM) software to identify bottlenecks at the design phase. This bypasses hardware launch delays and addresses the sub-micron misalignment risks of advanced packaging (Timothy Zhao, 2026, Vayo Technology).
Click below for the presentation:
20260417_Electronics_Manufacturing_Executive_Market_Intelligence_Briefing
Jon Custer
Custer Contexo Group
jon@custerconsulting.com
Market Intelligence | For Those That Need To Know